
Introduction
Trading in the Indian stock market can be both exciting and challenging, particularly for novice to intermediate traders and investors. The combination of Fibonacci Retracements and Elliott Wave Theory is a powerful strategy that can enhance trading and investment decisions. In this blog, we will explore how these two techniques can be used together, discuss the Fibonacci indicators, and provide a detailed Fibonacci strategy for traders in India. This comprehensive guide is designed to help you understand and implement these strategies effectively while optimizing your trading approach for better results. By the end of this post, you will have valuable insights and practical knowledge to improve your trading strategies in the Indian stock market.Understanding Fibonacci Retracements
What are Fibonacci Retracements?
Fibonacci Retracements are horizontal lines that indicate where support and resistance levels are likely to occur. They are based on the Fibonacci sequence, a series of numbers where each number is the sum of the two preceding ones, often found in natural and financial phenomena.Key Fibonacci Levels
The most commonly used Fibonacci retracement levels are:- 23.6%
- 38.2%
- 50%
- 61.8%
- 78.6%
How to Use Fibonacci Retracements in Trading
To use Fibonacci retracements effectively:- Identify the Trend: Determine the direction of the market trend.
- Select High and Low Points: Choose the significant high and low points of the trend.
- Apply Fibonacci Retracement Tool: Draw the retracement levels between these points.
- Analyze Levels: Observe the price action around the key Fibonacci levels to make informed trading decisions.
Introduction to Elliott Wave Theory
What is Elliott Wave Theory?
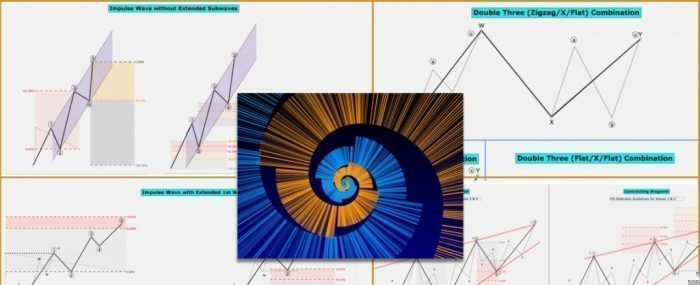
Elliott Wave Theory, developed by Ralph Nelson Elliott, is a form of technical analysis that traders use to analyze market cycles and forecast future market movements. The theory is based on the idea that market prices unfold in specific patterns, called waves, which are driven by collective investor psychology.Key Components of Elliott Wave Theory
- Impulse Waves: These are five-wave patterns that move in the direction of the overall trend.
- Corrective Waves: These are three-wave patterns that move against the trend.
Applying Elliott Wave Theory in Trading
To apply Elliott Wave Theory:- Identify Wave Patterns: Recognize the impulse and corrective wave patterns.
- Analyze Wave Structure: Study the structure of each wave to predict future price movements.
- Combine with Other Tools: Use other technical analysis tools, such as Fibonacci retracements, to enhance accuracy.
Combining Fibonacci Retracements with Elliott Wave Theory
Why Combine Fibonacci Retracements and Elliott Wave Theory?
Combining Fibonacci retracements with Elliott Wave Theory can provide a more comprehensive analysis of market trends and potential reversal points. The Fibonacci levels can help confirm wave patterns and improve the accuracy of predictions.Steps to Combine Both Techniques
- Identify the Trend Using Elliott Waves: Determine the overall trend using Elliott Wave Theory.
- Draw Fibonacci Retracements: Apply Fibonacci retracement levels to the identified trend.
- Analyze the Confluence: Look for areas where Fibonacci levels and Elliott waves intersect, as these are high-probability zones for potential reversals or continuations.
Example: Applying the Combination in the Indian Stock Market
Let’s take an example of the Nifty 50 index. Suppose you identify an upward impulse wave using Elliott Wave Theory. You then apply Fibonacci retracements from the low to the high of this wave. If the price retraces to the 38.2% level and you observe a corrective wave pattern, this confluence can indicate a strong support area, suggesting a potential buying opportunity.Trading with Fibonacci Indicators
Introduction to Fibonacci Indicators
Fibonacci indicators are tools based on the Fibonacci sequence that help traders identify potential support and resistance levels, entry and exit points, and trend reversals. The most commonly used Fibonacci indicators include:- Fibonacci Retracements
- Fibonacci Extensions
- Fibonacci Arcs
- Fibonacci Fans
Using Fibonacci Indicators in the Indian Stock Market
- Fibonacci Retracements: Identify key levels for potential reversals.
- Fibonacci Extensions: Determine profit targets by extending the Fibonacci levels beyond the initial trend.
- Fibonacci Arcs and Fans: Analyze the dynamic support and resistance levels using arcs and fans.
Practical Tips for Trading with Fibonacci Indicators
- Combine Fibonacci indicators with other technical analysis tools for better accuracy.
- Use multiple time frames to get a broader perspective.
- Always set stop-loss levels to manage risk effectively.
Fibonacci Strategy for Traders
Developing a Fibonacci Trading Strategy
A well-defined Fibonacci trading strategy can enhance your trading performance. Here’s a step-by-step approach to developing a strategy:- Identify the Trend: Use Elliott Wave Theory to determine the market trend.
- Apply Fibonacci Retracements: Draw the retracement levels on the identified trend.
- Look for Confluences: Identify areas where Fibonacci levels and Elliott waves intersect.
- Set Entry and Exit Points: Use these confluences to determine entry and exit points.
- Manage Risk: Set stop-loss levels below key Fibonacci retracement levels to minimize losses.
Example: Fibonacci Strategy in Action
Consider a stock like Reliance Industries. Suppose you identify a bullish trend using Elliott Wave Theory. You draw Fibonacci retracements from the low to the high of the trend. The price retraces to the 61.8% level and shows signs of reversal. This confluence indicates a strong support level, making it a potential entry point. You set a stop-loss below the 61.8% level and aim for profit targets at the Fibonacci extension levels.Optimizing Your Trading Approach
Combining Technical Analysis Tools
To optimize your trading approach, combine Fibonacci retracements and Elliott Wave Theory with other technical analysis tools such as moving averages, RSI, and MACD. This multi-faceted approach can provide a more comprehensive analysis and improve the accuracy of your predictions.Backtesting Your Strategies
Before applying your strategies in live trading, backtest them on historical data to evaluate their effectiveness. This can help you refine your approach and increase your confidence in your trading decisions.Staying Updated with Market News
Keep yourself updated with the latest market news and economic events that can impact the Indian stock market. This information can help you make more informed trading decisions and adjust your strategies accordingly.Leveraging Technology
Utilize trading platforms and tools like AlphaShots.aito validate your stock market-related tips and strategies. AlphaShots.ai helps you match current candlestick patterns with historical patterns using AI, providing valuable insights to enhance your trading decisions.
Conclusion
Combining Fibonacci retracements with Elliott Wave Theory can significantly enhance your trading and investment strategies in the Indian stock market. By understanding and applying these techniques, you can identify potential reversal points, set effective entry and exit points, and manage risk more efficiently. Remember to combine these strategies with other technical analysis tools, backtest your approaches, and stay updated with market news to optimize your trading performance. For more insights and advanced trading strategies, subscribe to our blog. Don’t forget to check out AlphaShots.aito validate your stock market tips and strategies using AI-driven analysis. Happy Trading!
Top 5 Links
- https://elliottwave-forecast.com/elliott-wave-theory/
- https://elliottwave-forecast.com/trading/fibonacci-retracement-and-fibonacci-extension/
- https://www.niftytrader.in/elliott-wave-fibonacci-cluster-calculator
- https://www.elearnmarkets.com/school/units/basics-of-elliott-wave/fibonacci-ratio
- https://elitecurrensea.com/education/elliott-wave-patterns-fibonacci-relationships-core-reference-guide/

Do not Guess! Take control of your trades in just 2 clicks
Validate your Next Trade with Alphashots.AI
Trade with peace of mind